
United States Equine Market 2023
by Jenny Alonge

Horse-related activities, from horse racing to hunter-jumper shows, are extremely popular in the United States. The equine industry not only entertains numerous horse enthusiasts but also contributes significantly to the nation’s economy. The following article provides horse industry statistics for 2023.
The United States is home to more than seven million horses
According to the American Horse Council Foundation (AHCF) data, with input from the National Agricultural Statistic Service (NASS) and the American Veterinary Medical Association (AVMA), 7,246,835 horses live in the United States, including those used for recreational and commercial purposes. Numbers based on activity include:
- Recreational horses — Recreational horses account for 43% (31,141,449).
- Show horses — Show horses, such as hunter-jumpers and dressage horses, account for 17% (1,227,986).
- Racing and racehorse breeding — Racehorses or horses used to breed account for 17% (1,224,482).
- Workhorses — Horses used for farm or ranch work, police work, rodeos, and polo account for 8% (537,261).
- Amish-owned — Amish-owned horses account for 2% (156,430).
- Other — Other horses account for the remaining 13% (959,227).
The horse industry contributes $122 billion annually to the U.S. economy
The AHCF estimates that the horse industry contributes $122 billion to the U.S. economy every year. This includes $50 billion in goods and services and $38 billion in direct wages, salaries, and benefits that directly affect other economic sectors for the combined $122 billion estimated total. The industry contributes most to the state gross domestic product (GDP) in Kentucky (1%), Oklahoma (0.62%), and Florida (0.26%). Interestingly, California, which has the second highest number of horses in the United States, has the second lowest GDP contribution shares from the horse industry.
The U.S. horse industry employs 1.74 million people
The horse industry employs more people than railroads, radio and television broadcasting, petroleum and coal products manufacturing, and tobacco product manufacturing. The AHCF estimates that the industry directly employs 988,394 people and that the direct economic activities prompt more enterprise outside the horse industry, resulting in a total 1.74 million jobs. The industry contributes $38 billion in direct wages, salaries, and benefits. In addition, more than 1.3 million people volunteer for horse-related jobs annually.
The majority of horse owners are female
Approximately 92.6% of horse owners are female. Other equestrian demographic data include:
- 52% are married
- 58% are college graduates
- 60% work in managerial positions
- Four out of five are members of at least two equestrian organizations
- The median age is 38 years
- The majority are between 45 and 59 years of age
- Millennials account for 42% of horse owners
- 41% are older than 45
- 53.4% of horse-owning families have only one equestrian in the household
Only 1.3% of U.S. households own horses
Only 1.3% (i.e., 1.6 million) households in the United States own horses, but 30.5% (i.e., 38 million) households have a horse enthusiast or spectator. About 16% of participants in horse-related activities don’t own a horse, and 13.2% of people who watch horse events don’t own or ride horses.
The average horse owner owns six horses, and many provide horse-related services, such as:
- Horse training (20%)
- Horse-riding lessons (17%)
- Farm management (19%)
- Horse breeding (14%)
- Farrier services (5%)
- Other services, such as boarding and equine-assisted therapy (23%)
Veterinarians or veterinary assistants own 5% of horses.
Most horse owners have an above-average annual income
The typical U.S. horse owner has an average net worth of $1,504,051 and a household income of $211,738. Most (i.e., 84%) own their own home and have an average of three vehicles. In addition, 85% are active in the stock market, and have an average investment portfolio worth $724,791. Equestrians who have an annual income under $50,000 account for only 15% of horse owners.
The average horse price varies
The average horse price depends on many factors, such as the pedigree, health, and training level. Average costs by use include:
- Recreational horse — The average price for a recreational horse is $3,444.
- Show horse — A typical show horse costs more than $11,248.
- Racehorse — The average racehorse sales price is $45,532.
Owning a horse is expensive
The cost of horse ownership involves much more than the purchase price, which is why most horse owners have an above average annual income. The average equestrian spends about $11,335 annually on their horse. Specific costs include:
- Board — Housing for the horse can cost $1,200 to $7,200 annually.
- Feed — Grain and hay costs can range from $250 to $4,380 annually.
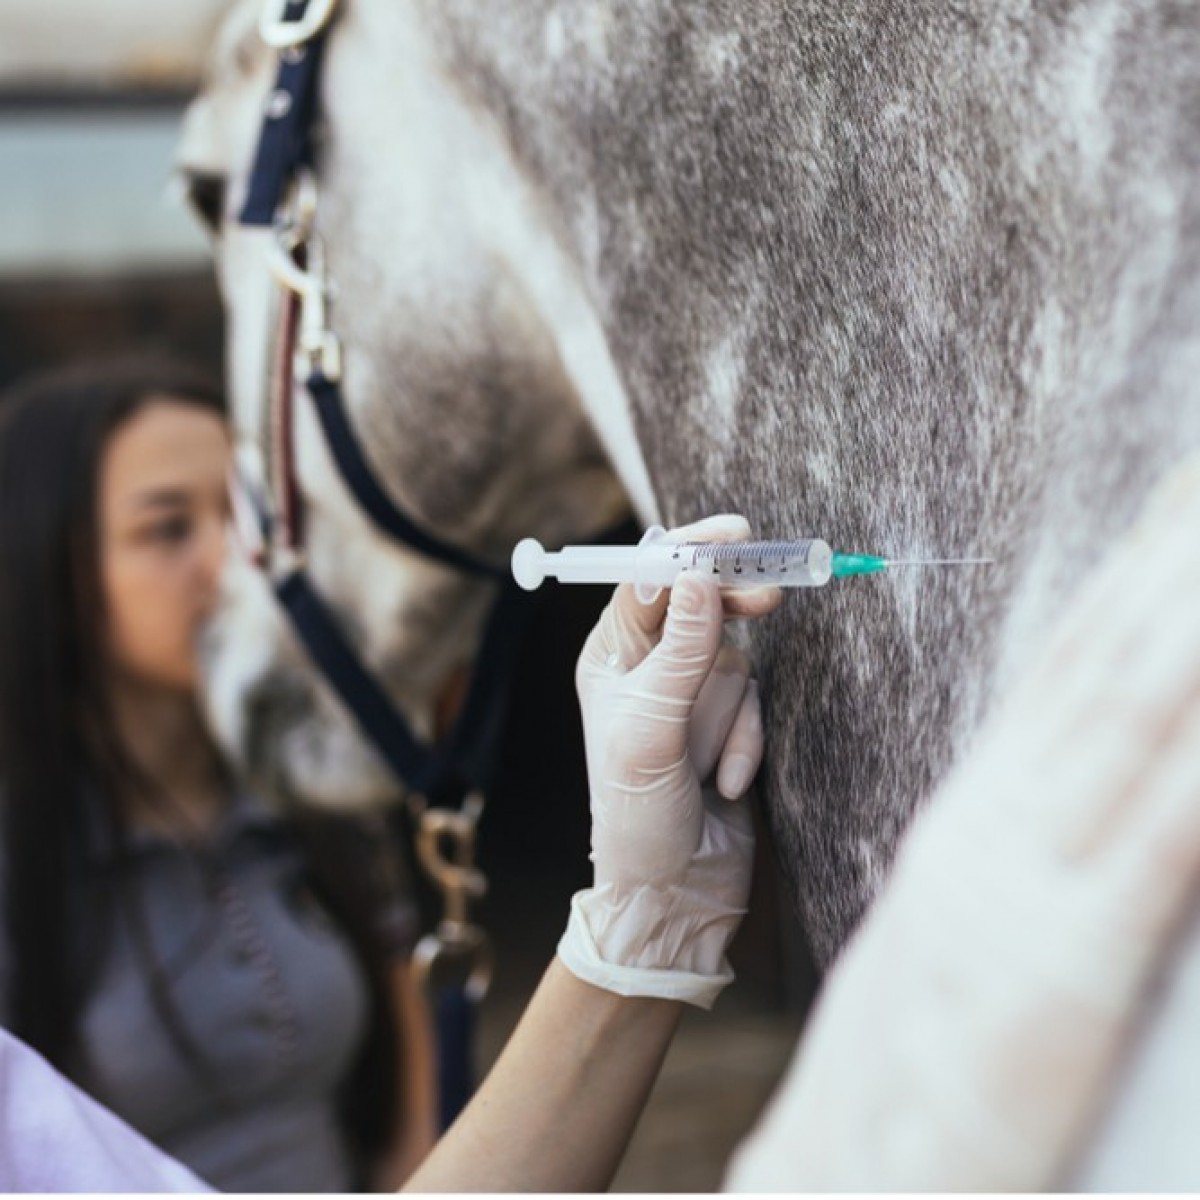
- Veterinary — Routine veterinary care can cost between $350 to $600 per year, and costs can increase significantly if the horse experiences a medical emergency (e.g., colic).
- Farrier — Yearly farrier costs range from $300 to $2,000.
- Training — Training costs can range from $4,800 to $8,400 annually.
- Insurance — Equine insurance typically costs about $150 to $500 per year.
Other potential expenses include tack, clothing, grooming tools, track usage, show fees, and transportation costs.
 Comments
Related Articles


Copyright © 2026 - All Rights Reserved
ISSN 2768-198X
List
Add
Please enter a comment