
Negative financial performance in the markets: How to recover?

This is the question on the minds of millions of investors. Let's look at the chart below as we explore this topic.
The white line at the top indicates the global bond market (Global Aggregate Index) and its drop. The decline or correction stems from a previous relative or absolute high. Meanwhile, the blue line represents the global stock market (MSCI World), also with its decrease.
While stock markets have experienced declines, some of them even more severe than the current one, and eventually recovered from negative performance, the bond market is facing an unprecedented situation.
The chances of seeing a 10-year government bond at 0.5% — as we did in February 2021 — is nearly zero. Hoping for a full recovery of bond performance at those interest rates will remain a mere illusion.
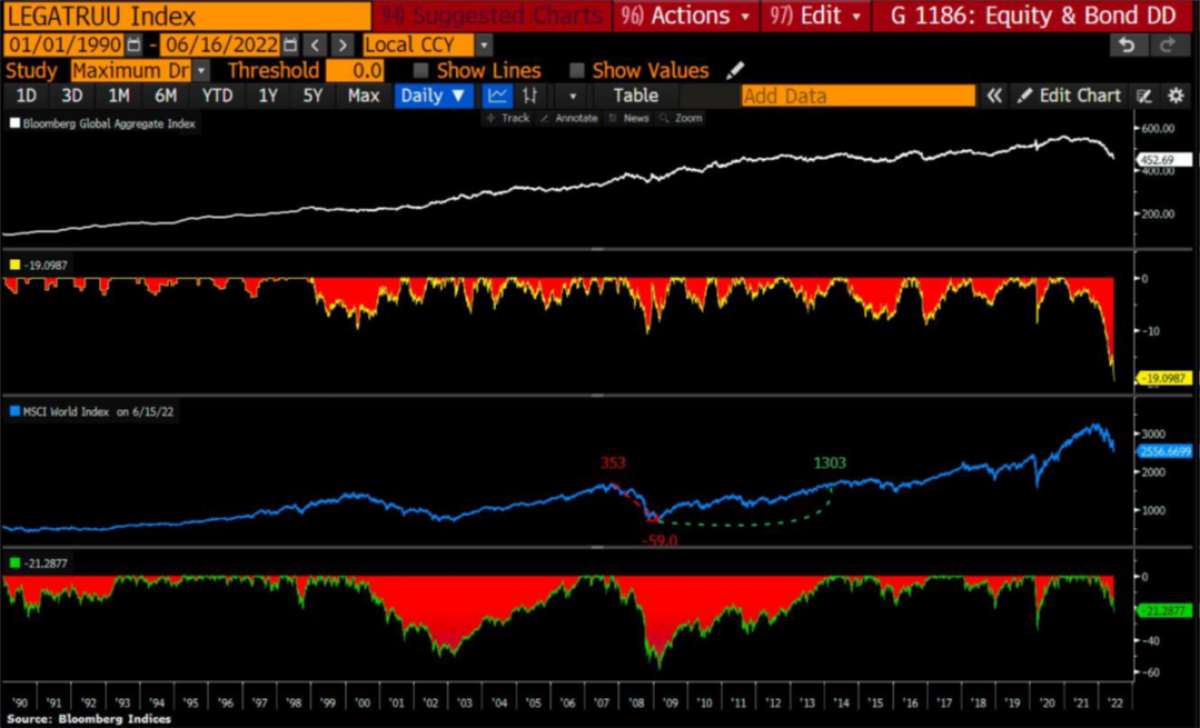
Source: Bloomberg Indices
On the other hand, the reason to be optimistic with stocks is different: it is highly likely that they will reach new highs and surpass previous records.
With that said, here are some pieces of advice for investors:
- If you haven't reduced your bond holdings so far, it doesn't make much sense to do it now.
- Not selling doesn't mean you should increase your bond fund exposure. Buying a bond means buying a yield: the current interest rate, which will likely continue to rise, will reflect negatively in the price with further losses.
- Control your emotions and don't change your strategic financial planning. Stay the course and be patient, given the way things can change over time.
- Prioritize the stock market and don't expect everything to happen all at once.
- Manage liquidity: the more the market goes down, the more you should buy. Eventually, you will come out ahead.
- Avoid the "do-it-yourself" approach, refrain from buying individual stocks, and always consult a financial advisor.
- War and a subsequent energy transition will in the future generate an exponential rise in investments related to environmental, social and governance parameters.
- Don't check your portfolio's performance every week, neither during market upswings nor corrections. That's the best way to avoid emotional mistakes inherent in our psyche.
 Comments
Related Articles


Copyright © 2026 - All Rights Reserved
ISSN 2768-198X
List
Add
Please enter a comment